I’ve got another Sparkle video card for review today, no it’s not another GT240, it’s the GT430. It’s a small low-profile card so it would work great with an HTPC, or a small, basic gaming system. You’re not going to be playing Crysis on it but it can handle some other light gaming and as a plus it is Direct X 11 capable.
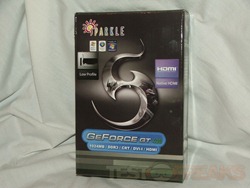
The box is fancy looking with specs listed on it.
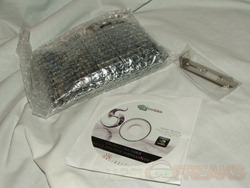
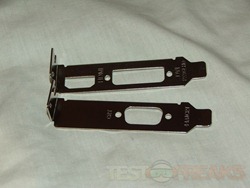
Inside you’ll find the card wrapped in bubble wrap and an anti-static bag along with extra PCI brackets and the driver software CD.
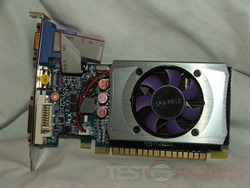
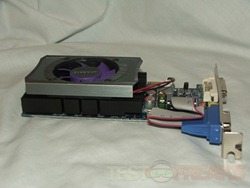
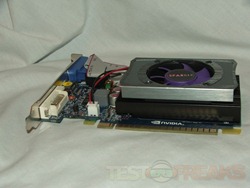
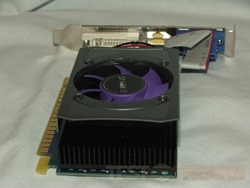
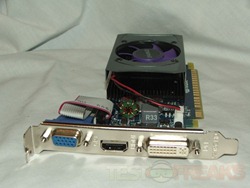
The GT430 is a low profile style card so it can fit into smaller cases. The VGA port can actually be removed to make it even shorter. The card though does feature a rather fat heatsink which could pose a problem covering the slot closest to it. The card features VGA, DVI and HDMI ports.
Specifications:
GeForce GT430 1024MB DDR3 Low Profile
Model No: SXT4301024S3LNM
GPU / VPU: NVIDIA GeForce GT 430
Processor Technology: 40nm
Processor Cores: 96 cores
RAMDAC: Dual 400MHz
Bus Type: PCI-EXPRESS 2.0
Bus Speed: 16x
Video Memory: 1024 MB
Memory Type: DDR3
Memory Interface: 128-bit
Core Clock: 700 MHz
Shader Clock: 1400 MHz
Output Connectors: HDMI x1, Dual-Link DVI x1, VGA x1
HDCP Capable: Yes
Overclocked: No
Cooling System: Fan
Video Card Profile: Low Profile
Video Card Slot: Double Slot
Power Connector: No
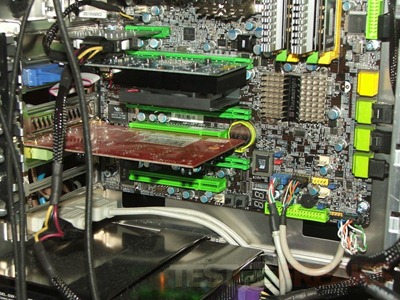
Same system as the other cards of course, C2Q9650, 8 gigs ram on a DFI Lanparty UT X48 T3RS motherboard. Here it is installed, the card is rather fat and will possibly cover the slot below.
Let’s get started with the testing, I’ve put the GT430 up against all of those GT240s I’ve reviewed recently. Same tests basically but with the addition of Cinebench 11.5 as well.
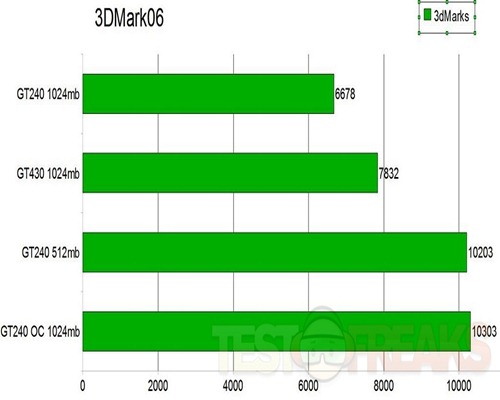
First up would be 3DMark06:
It’s a GT430 so I expected it to do much better than the GT240 cards, but I was wrong apparently.
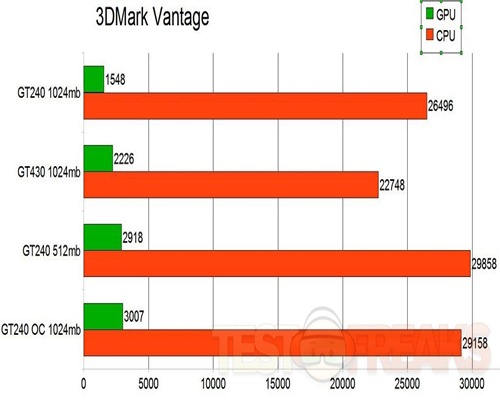
Next up would be 3Dmark Vantage at default settings with resolution to 1920×1080.
Same here, rather low by performance standards, but still fairly close to the others.
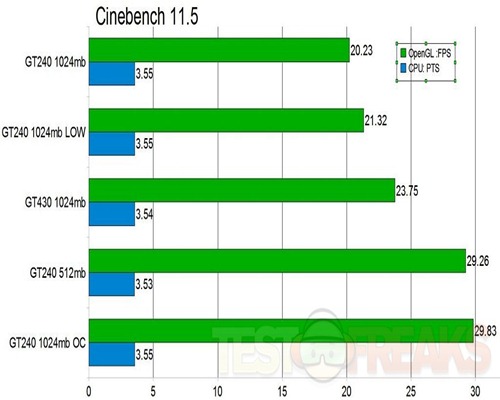
Next test would be Cinebench 11.5:
vHow Does MAXON CINEBENCH Work?
The test procedure consists of two main components – the graphics card performance test and the CPU performance test.
Main Processor Performance (CPU)
The test scenario uses all of your system’s processing power to render a photorealistic 3D scene (from the viral “No Keyframes” animation by AixSponza). This scene makes use of various algorithms to stress all available processor cores.
In fact, CINEBENCH can measure systems with up to 64 processor threads. ThIS test scene contains approximately 2,000 objects which in turn contain more than 300,000 polygons in total, and uses sharp and blurred reflections, area lights, shadows, procedural shaders, antialiasing, and much more. The result is displayed in points (pts). The higher the number, the faster your processor.
You can find more specific technical information on this on the tech-page of CINEBENCH.
Graphics Card Performance (OpenGL)
This procedure uses a complex 3D scene depicting a car chase (by renderbaron) which measures the performance of your graphics card in OpenGL mode. The performance depends on various factors, such as the GPU processor on your hardware, but also on the drivers used. The graphics card has to display a huge amount of geometry (nearly 1 million polygons) and textures, as well as a variety of effects, such as environments, bump maps, transparency, lighting and more to evaluate the performance across different disciplines and give a good average overview of the capabilities of your graphics hardware. The result given is measured in frames per second (fps). The higher the number, the faster your graphics card.
The GT430 falls squarely in the middle here.
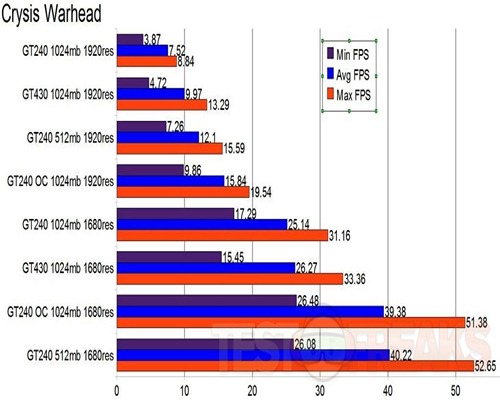
Next would be Crysis Warhead at 1680 and 1920 resolutions.
Well still not what I expected in terms of performance for the GT430 and Crysis Warhead isn’t exactly playable with it either.
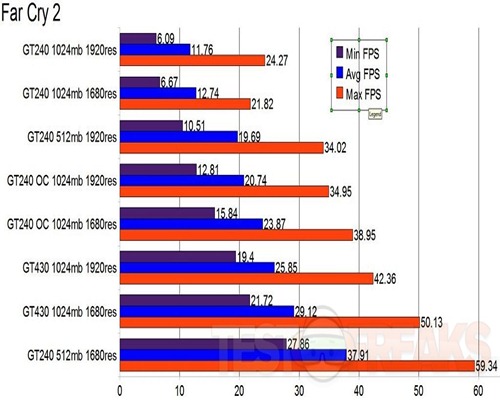
Next is Far Cry 2, same thing with two different resolutions:
The GT430 does a lot better here as you can see.
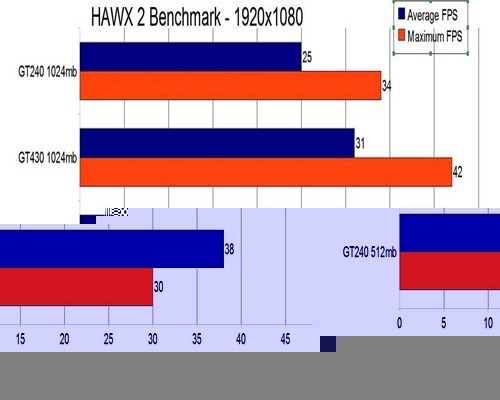
Then next up let’s see how the GT430 does with HAWX2:
Average is 31 FPS, I guess not too bad, just barely playable.
Lastly let’s take a look at a couple from SiSoft Sandra.
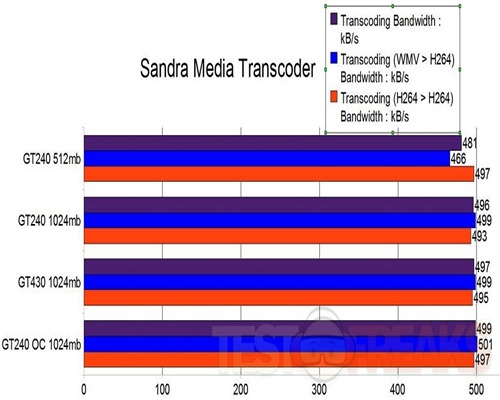
The first is the media transcoder test:
Media Transcode
Measures the media transcoding performance, i.e. decoding video & audio from one format and then encoding it to another. Shows how your processors or hardware accelerators handle transcoding in comparision to other typical transcoders.
Such operations are used when converting media from a camcorder to your computer and then to a device (TV, tablet, phone, etc). Transcoding is needed as each device might use a different media format (and thus container or codec) or support different profiles (resolution, etc.).
Explanations
WMV (e.g. from Movie Maker) to MP4/H264 (TV, tablet, phone, etc.)
MP4/H264 (e.g. from camcorder) to MP4/H264 (TV, tablet, phone, etc.)
Profile you can select various profiles to test: HD TV, SD TV, Tablet, Phone.
See also Questions and Answers document for full information.
Results Interpretation:
WMV to H264 (MB/s) – higher results are better, i.e. better transcoding performance.
H264 to H264 (MB/s) – higher results are better, i.e. better transcoding performance.
They’re all fairly close here.
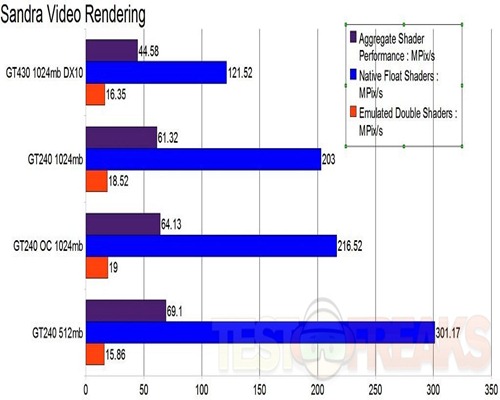
Next would be the video rendering test:
Video Rendering
Benchmark the graphics performance of the video adapters (GFXs).
Such operations are used by all graphics software, image manipulation, video decoders/encoders, games and modern operating systems.
Explanations:
The test involves the generation of Mandelbrot Set fractals that are used to realistically describe and generate natural objects such as mountains or clouds. Such instructions are used for audio and video encoding and decoding, games and other applications where the same operation needs to be applied to large amount of data.
Results Interpretation:
Float Shaders (Pixels/s) – higher results are better, i.e. better single (32-bit) floating-point performance.
Double Shaders (Pixels/s) – higher results are better, i.e. better double (64-bit) floating-point performance.
Here the GT430 does the worst oddly, I expected a lot better.
The card is quiet even under load, I’m guessing that’s because of the rather large heatsink. The heatsink seems to work but it might block the slot below the card, and in smaller cases it might become a bigger problem.
It’s not exactly meant to be a gaming video card is it? It would work fine for a basic HTPC I would guess.
Conclusion:
The GT430 isn’t exactly what I expected, I really thought it would perform much better than any of the GT240 cards, but I was wrong. It should work fine for light gaming.
It’s a small, low-profile card so it would work great in smaller cases. The GT430 is quiet and it does play HD video very well.
Pros:
+Low profile with extra brackets
+Decent performance
+Relatively quiet
+No extra power connection
+Direct X 11 capable
Cons:
-Rather fat card
| Grades: | |
| Overall |  |
| Design |  |
| Performance |  |
To learn more about our review policy please visit this page HERE.

