The Corei5 was just introduced about 2 weeks ago and iBuyPower was gracious enough to send me over a complete system for review. The Corei5 is the new budget CPU and I’ve put it up against my current system with a C2Q9650 in it that also has double the ram and a better performing video card. Will that make a difference, or is the new architecture of the Corei5 better overall? So I’m looking at this in terms of an upgrade from my own system, or any other C2Q system really… So read on..
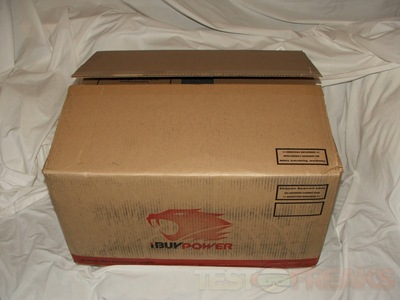
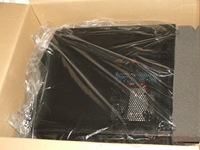
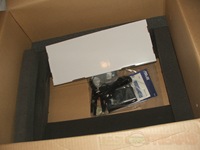
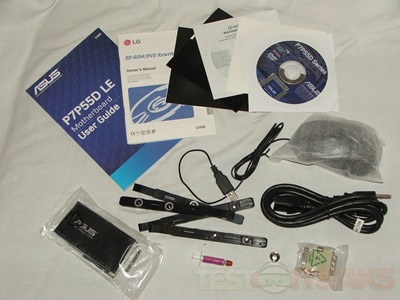
The system comes packaged very well in a large box, with the PC well padded inside. Under the PC you’ll find all of your accessories that comes with the parts of the system if you would buy them separately.
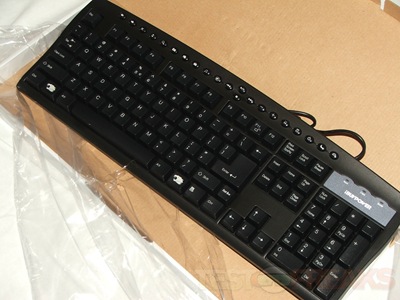
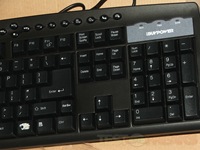
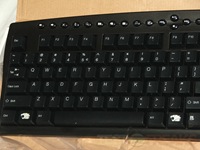
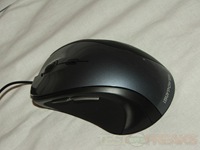
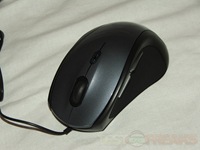
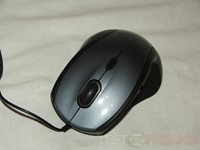
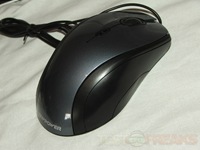
Included also is an iBuyPower branded keyboard and optical mouse:
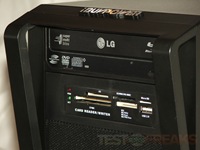
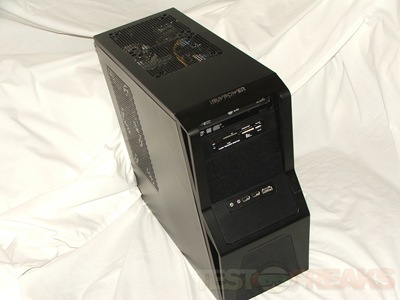
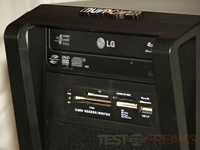
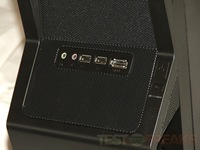
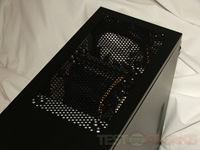
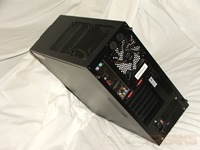
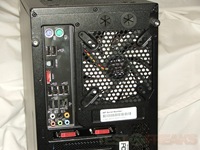
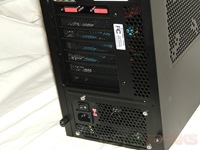
The system comes in an NZXT Gamma case, a nice plain black case with plenty of ventilation to keep the system running cool. There’s a card reader and an LG blu-ray reader/dvd/rw drive pre-installed as well.
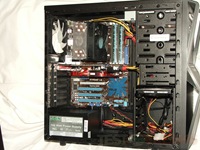
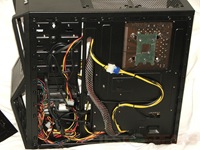
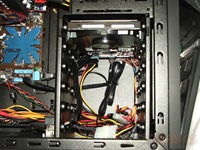
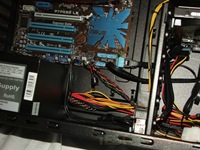
Moving inside we find a very nice wiring job, iBuyPower has everything out of the way and tied down making for not only good airflow but a nice clean look as well.
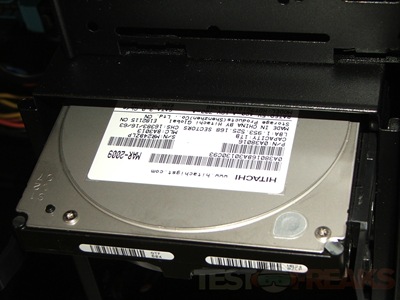
The included hard drive is a 1TB Hitachi 7200RPM:
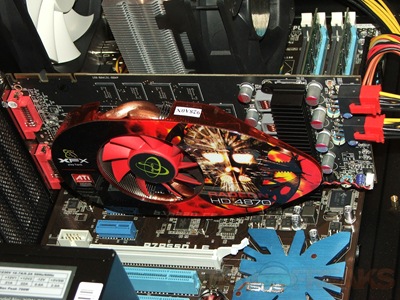
The video card is an XFX ATI Radeon 4870 with 1gig of ram:
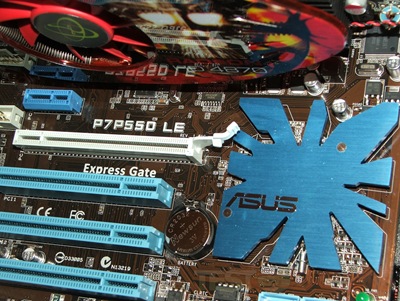
The motherboard is an ASUS P7P55D LE:
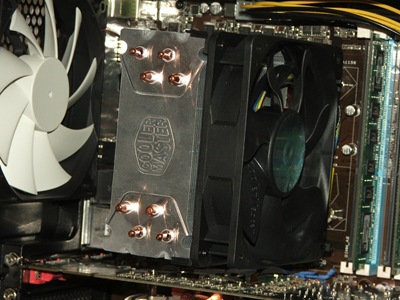
The CPU is a Core i5 with a Cooler Master CPU Cooler on it:
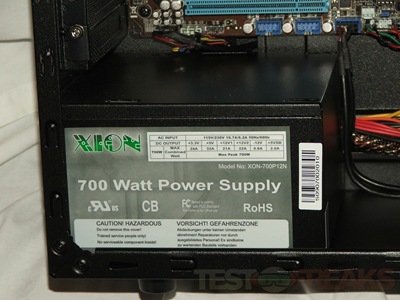
Power supply is a 700Watt Xion:
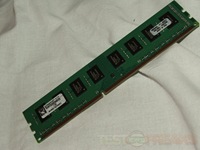
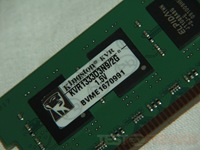
The installed ram is Kingston DDR3-1333
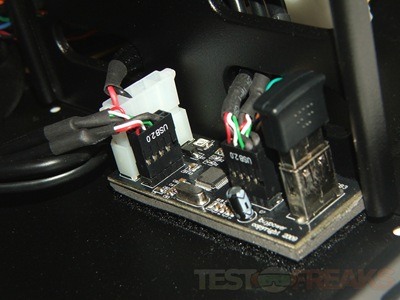
One of the unique features of this system is the inclusion of the iBuyPower internal power USB hub with BlueTooth. I posted about this a little bit ago in the PR section of the site when it was announced, you can read all about it HERE.
Essentially what it is is two extra USB headers with a standard USB port and a Molex connection to provide more power to the UBS headers if need be.
Specifications:
MSRP: $999
Case: NZXT Gama
Power: Xion 700W
Motherboard: ASUS P7P55D LE
CPU: Intel Core i5 750
–Overclock: 5-10%
Memory: 4GB DDR3 1333
Hard Drive: Hitachi 1TB 7200RPM
Optical: LG BLU-RAY Reader
Media: 12-in-1 Media Card Reader/Writer
Video: XFX ATI 4870 1GB
Sound: Built-in 8 Channel Surround Sound
Network: Integrated Gigabit Ethernet Network LAN
Accessories: Internal Powered USB Hub with Bluetooth
Software: Microsoft Windows Vista Home Premium 64-Bit Edition
KB & Mouse: iBUYPOWER Keyboard + Optical Mouse
Warranty: 3-Yr Limited Warranty + Lifetime Support Service
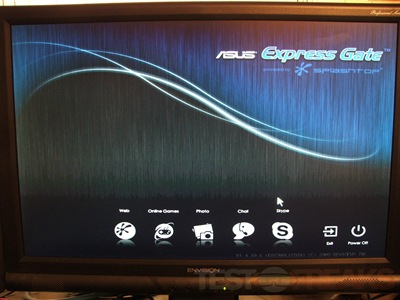
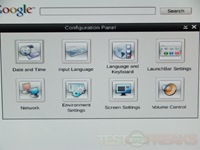
Before we get into the comparison, I wanted to touch on the Express Gate Asus Splashtop. It’s a nice feature so you can get some stuff done, without actually having to boot into windows, the entire OS is right on the board itself. I’m not going to go into it all as it’s been covered many other places in depth but it’s a very useful, and quick to do quite a few things.
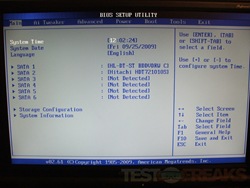
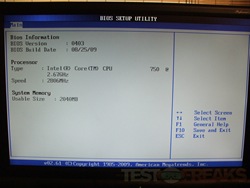
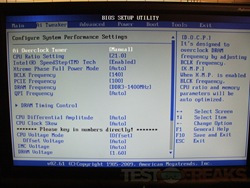
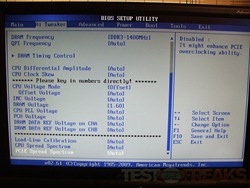
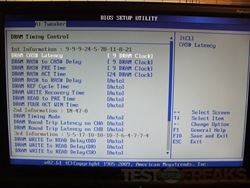
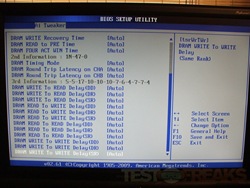
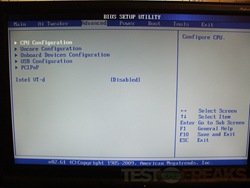
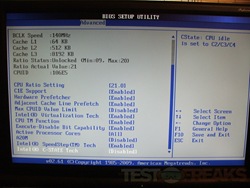
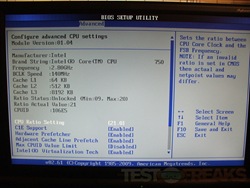
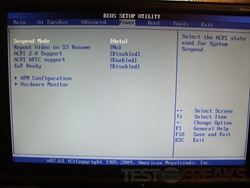
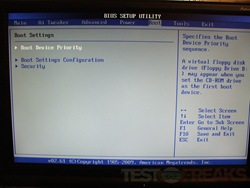
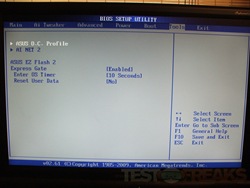
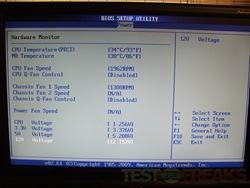
Next we’ll check out the Bios of the ASUS P7P55D LE Board. There’s quite a bit of options on this board to help you do a bit of overclocking if need be, and many settings to change and tweak to your own liking.
So for comparison I’m putting the iBuyPower system up against my own system that’s getting a bit old actually, but still hanging in there.
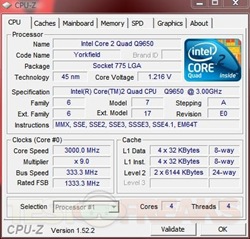
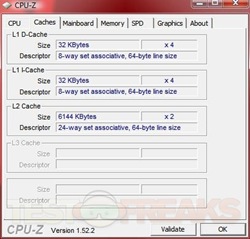
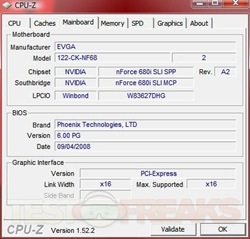
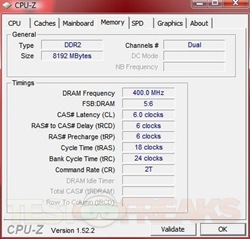
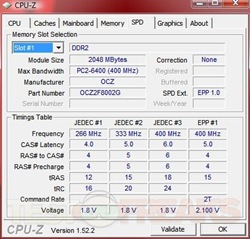
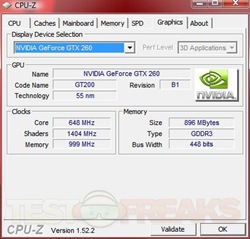
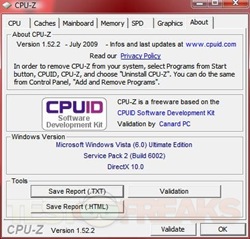
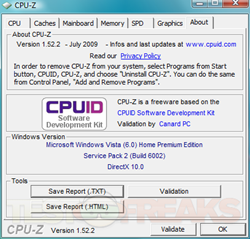
Here’s the CPU-Z info for my system:
It consists of:
EVGA NF680i-SLI Motherboard
Sparkle GTX260 (main card)
EVGA 8600GTS (physx)
ECS GTS 250 (power dual secondary monitors)
Intel C2Q9650
8gig of OCZ Fatal1ty Ram DDR2 6400
1TB Samsung Hard drive
Liteon Blu-ray Reader
Windows Vista X64 Ultimate
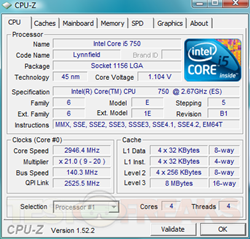
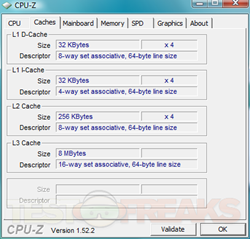
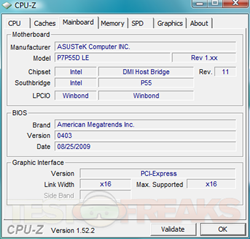
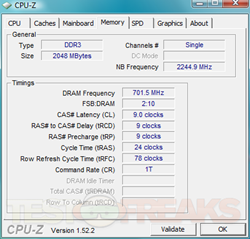
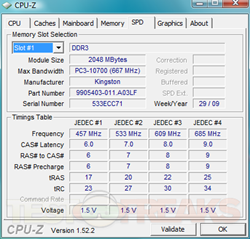
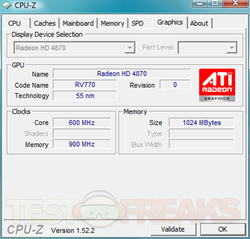
We already know what’s in the iBuyPower System but here’s the CPU-Z reports for it:
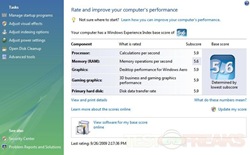
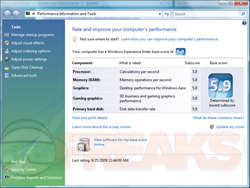
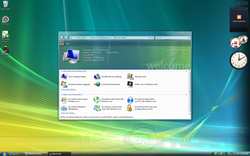
My system has a Windows Experience rating of 5.6 while the iBuyPower system gets a 5.9 rating.
One thing that surprised me about the iBuyPower system is that it was totally brand new, you had to enter the Windows key at startup and finish the setup process. Once you got to the desktop there was nothing there, no junk added to it, just what you would get from a clean install of Windows, which is nice.
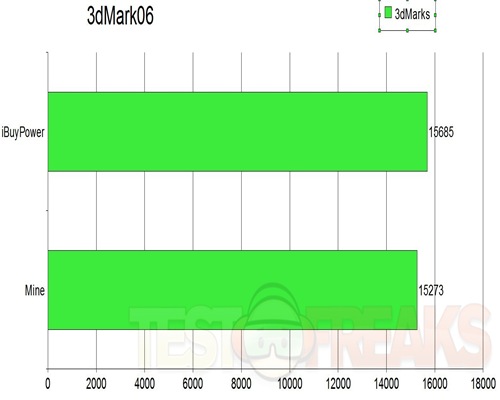
Ok, for the comparisons we’ll start off with 3DMark06, no explanation needed here, I think everyone know what it is:
My system apparently isn’t that bad, even though it’s a bit old…
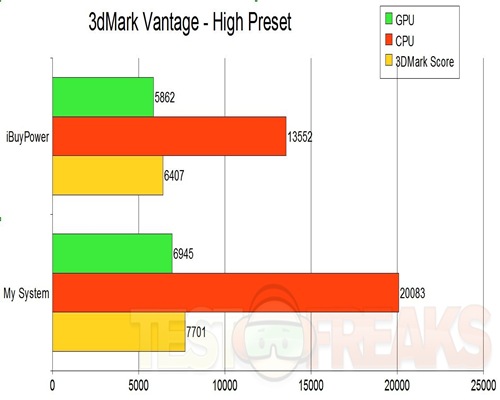
Next up we’ve got 3dMark Vantage:
Well according to this my system still has a bit of life left in it yet huh?!
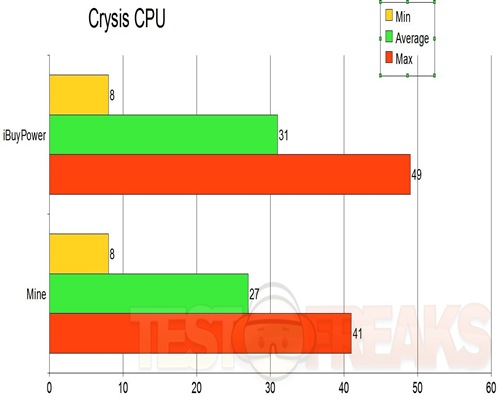
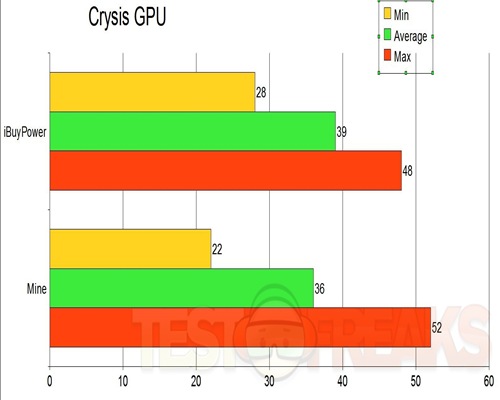
Next up I’ve got Crysis Benchmarks, both CPU and GPU tests.
The Settings for Crysis were 1680×1050 Resolution, with 2X AA, DX10 and the Quality Settings on High. Three run of the benchmark were done and then averaged out.
Here we see the Corei5 does a bit better than my C2Q9650.
I’m a bit surprised here that my GTX260 didn’t quite do as well as the 4870. When I had the 4870 in my system it scored worse than the GTX260, but I guess the system as a whole is what matters.
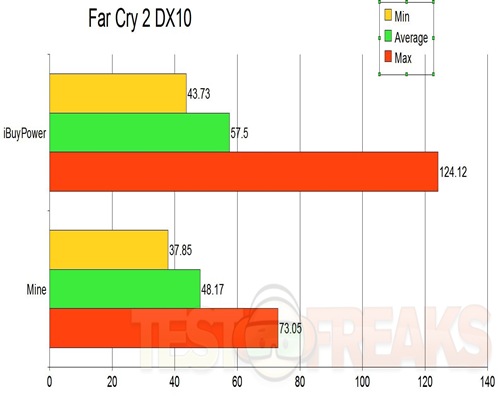
Next test is Far Cry2 Benchmark:
1680×1050 resolution, DX10, Settings set to Very High with 2X AA, no VSync.
So here we see the iBuyPower system handling it much better than mine, still though it’s very playable on both systems.
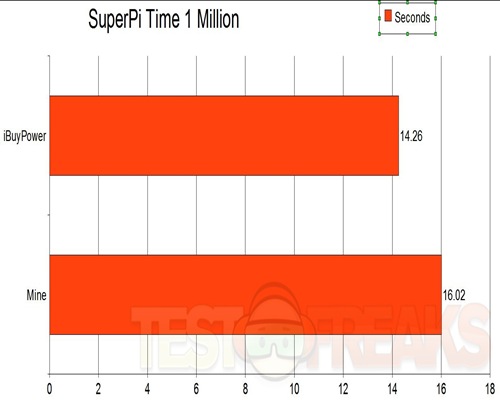
The next test I ran was the basic Pi test, Super Pi to be exact, the time to calculate Pi to 1 million places. Lower time is better of course.
Obviously the Corei5 is a bit better than my C2Q.
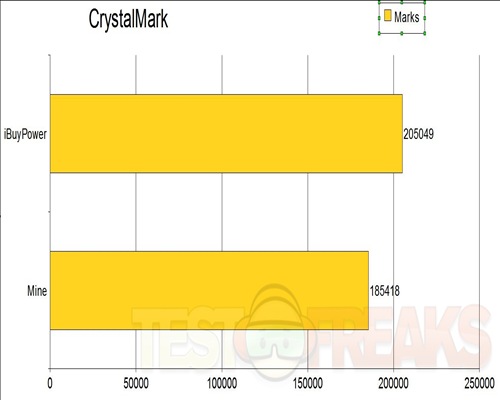
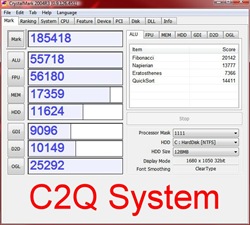
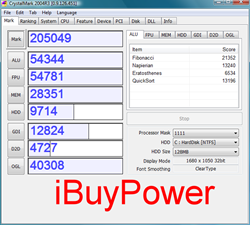
Next up I decided to test the entire system with Crystalmark.
As you can see the iBuyPower system is much better.
Here’s the actual results with the breakdown of the scoring for each system:
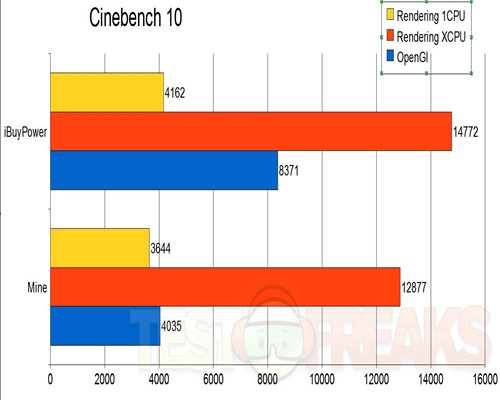
Next up is Cinebench10:
CINEBENCH is a real-world test suite that assesses your computer’s performance capabilities. MAXON CINEBENCH runs several tests on your computer to measure the performance of the main processor and the graphics card under real-world circumstances.
The test procedure consists of two main components: The first test sequence is dedicated to the computer’s main processor. A 3D scene file is used to render a photoreaslistic image. The scene makes use of various CPU-intensive features such as reflection, ambient occlusion, area lights and procedural shaders. During the first run the benchmark only uses one CPU (or CPU core) to ascertain a reference value. On computers that have multiple CPUs or CPU cores and on those that simulate multiple CPUs (via HyperThreading or similar technolgies), MAXON CINEBENCH will run a second test using all available CPU power.
The second test measures graphics card performance and is run inside the 3D editor window. The project file used can test all graphics cards that support the OpenGL standard. In this scene, only the camera was animated. This scene places medium to low demands on graphics cards and tests the maximum speed with which the scene can be properly displayed.
As you can see the iBuyPower system pretty much blows mine away.. oh well, I guess I truly do need to upgrade..
Ok, I think we’re about half way through this… the last set of tests is using SiSoft Sandra focusing on pretty much everything…
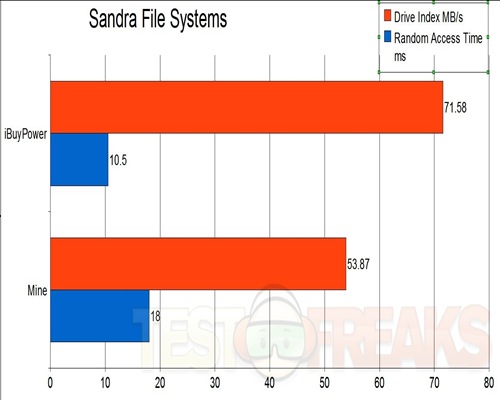
First up we’ll focus on the hard disks, mine is also a 1tb 7200RPM drive, so I was curious to see how it performed.
File Systems
Benchmark mounted file systems (i.e. volumes). Shows how your file systems connected to storage adapters and storage hosts compare to other devices in a typical computer.
This is not the raw disk performance that other benchmarks test – but the speed of the volume itself that depends on many more factors like file system, operating system cache, position on disk, etc. Thus this is the performance you get at the file system level.
Drive Index: is a composite figure representing an overall performance rating based on the average of the read, write, and seek tests, and file and cache size. The Drive Index is intended to represent drive performance under typical use in a PC. A larger number means better performance. The weighting of the results is not equal it represents the distribution of different files sizes as used on these devices (obtained through field research).
Drive Index:
Results Interpretation : Higher index values are better.
Random Access Time :
Results Interpretation : Lower index values are better.
Well, my drive isn’t that good apparently, or again it’s the system as a whole that helps the performance along.
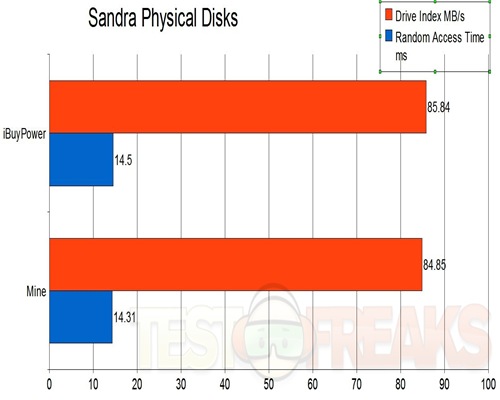
Next up is Physical Disks:
Physical Disks
Benchmark hard disks (i.e. the disk itself, not the file system).
As the test measures raw performance it is independent on the file system the disk uses and any volumes mounted off the disk.
Drive Index: is a composite figure representing an overall performance rating based on the highest read or write speed across the whole disk. Thus the higher the better.
Access Time: is the average time to read a random sector on the disk, analogous to latency response time. Thus the lower the better.
Here the scores are very close when this test is run with a populated disk.
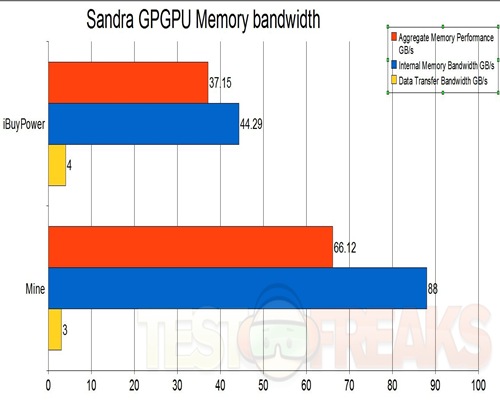
We already covered a few with the Video cards, but here’s another one from Sandra:
Graphics (GPGPU) Bandwidth
Benchmark the bandwidth of the memory of the graphics processors (GPGPUs) and the bandwidth of the bus that connects them to your computer
Results Interpretation:
Internal Memory Bandwidth (MB/s) – higher results are better, i.e. faster internal memory bandwidth.
Data Transfer Bandwidth (MB/s) – higher results are better, i.e. faster data transfer between the GPU and computer.
Apparently it’s a toss up between the GTX260 and the 4870 depending on what test is run…
Finally we’ll finish off with a few CPU and Memory related tests.
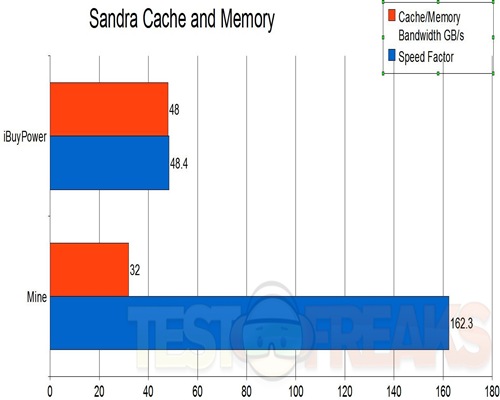
Processor Cache and Memory
Benchmark the processors’ caches and memory access (transfer speed).
Results Interpretation
Cache/Memory Bandwidth (MB/s) – higher results are better, i.e. faster memory bandwidth.
Speed Factor (MB/s) – lower results are better, i.e. less difference between processor cache speed and memory speed.
Combined Index: is a composite figure representing the overall performance rating of the entire Cache-Memory performance in terms of MB/s. The value is the logarithmic average of all the results for the entire address space. (Higher is better, i.e. better performance)
Speed Factor: is a figure representing the speed differential between the CPU’s cache and memory. The value is the ratio of the fastest cache (i.e. L1) bandwidth to the main memory bandwidth. (Lower is better, i.e. the memory is not very much slower than CPU’s cache)
hmm.. my C2Q got stomped pretty much there eh?
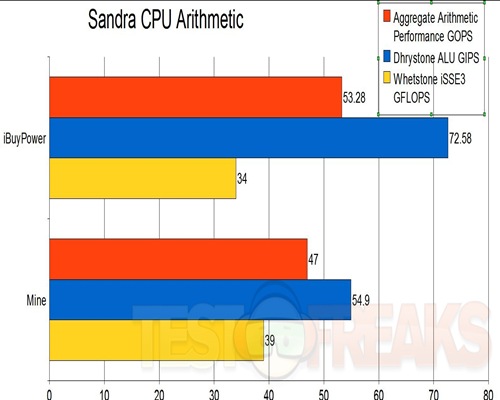
Processor Arithmetic
Benchmarks the ALU and FPU processor units. Shows how your processors handle arithmetic and floating point instructions in comparison to other typical processors.
Results Interpretation
Dhrystone (MIPS) – higher results are better, i.e. better integer performance.
Whetstone (MFLOPS) – higher results are better, i.e. better floating-point performance.
and yet again no surprise here, the Corei5 is much better.
On to the next test:
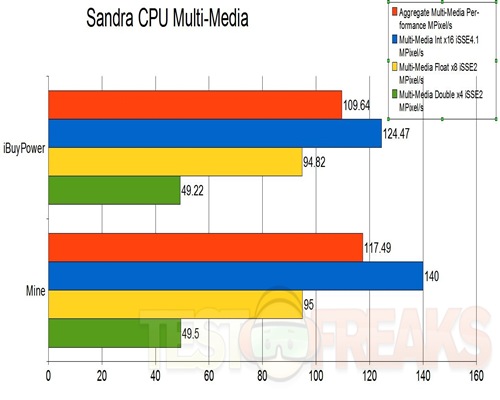
Processor Multi-Media
Benchmark the (W)MMX(2), SSE(2/3/4), AVX processor units. Shows how your processors handle multi-media instructions and data in comparison to other typical processors.
Such operations are used by more specialised software, e.g. image manipulation, video decoders/encoders, games.
Results Interpretation
Multi-Media Integer (Pixels/s) – higher results are better, i.e. better integer performance.
Multi-Media Single/Double Float (Pixels/s) – higher results are better, i.e. better floating-point performance.
A little closer in the scoring here, my C2Q isn’t too bad when it comes to Multi-Media related things…
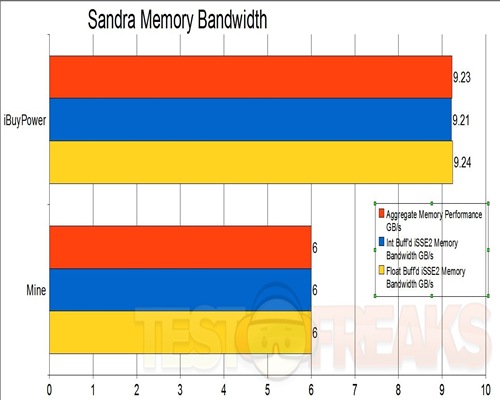
The final test is the Memory Bandwidth test:
Memory Bandwidth
Benchmark the memory bandwidth of your computer.
Results Interpretation
Integer Memory Bandwidth (MB/s) – higher results are better, i.e. faster memory bandwidth.
Float Memory Bandwidth (MB/s) – higher results are better, i.e. faster memory bandwidth
Obviously DDR3 is much better than my lowly DDR2..
Overall the iBuyPower system I think is a much better, as if we didn’t know that already..
So testing aside the system is nicely made.. but I do have two minor complaints and that’s regarding the included mouse and keyboard.
The mouse is optical, and it’s not that great really. I used it for about an hour and just couldn’t stand it, it skipped all over the place and just didn’t seem accurate at all.
The keyboard is ok, but it’s very lightweight and thin, I like a heavier and taller keyboard personally. If I had a choice I would not use the iBuyPower keyboard at all.
When the system is one it is a bit on the loud side, but not overly so, not enough to really complain about it, but you can plainly hear the fans spinning.
Conclusion:
The iBuyPower system is obviously a much better performer than mine as we can see from the test results.
The iBuyPower system is nicely designed, with great attention paid to the little details like the wiring inside, and it’s nice to not see any junk installed on the system like some companies tend to do. Overall the system is a very good performer from the CPU to the GPU. Anyone should be happy with the performance of it.
The keyboard and the mouse though are lacking, neither are not that good in my opinion, you’re much better off getting a better quality version of both, or if you’re upgrading using what you already have on hand.
Pros:
+Excellent performance
+Price is good for what you get
+Nicely designed
Cons:
-Mouse and keyboard are not the best
-System can be a bit loud
| Grades: | |
| Overall |  |
| Design |  |
| Performance |  |




1 comment for “iBuyPower Corei5 System Review”