So… Service Pack 2 arrived with not a lot of celebration, not much has been really mentioned about it at all anywhere. Being who I am though I like to know things, so I decided to run a whole bunch of tests before and after the upgrade and compare them to see just what, if anything, might have changed.
According to Microsoft here’s what’s in Service Pack 2:
Windows Vista? Service Pack 2 (SP2) is an important update that includes support for new types of hardware and emerging hardware standards, and it also includes all the updates that have been released since SP1. You’ll find information about the specific changes and improvements included in SP2 below. For more information about installing SP2, see Learn how to install Windows Vista Service Pack 2 (SP2).
Here are some of the improvements in SP2:
-Program compatibility. Microsoft works to ensure that your programs work seamlessly on Windows Vista. We also work with our partners to improve the reliability and compatibility of non-Microsoft programs. So, SP2 includes previously released updates that are available to you when you use Windows Update, and it also includes new compatibility fixes for individual programs.
-Hardware support. Among other improvements, SP2 provides you with additional support for Bluetooth wireless technology and improved performance for Wi-Fi connections after the computer resumes from sleep mode. Additionally, you can now record data to Blu-ray Disc media
– General operating system updates. SP2 includes Windows Search 4.0, which has improved indexing and searching capabilities. SP2 also includes fixes that can improve recording TV using Windows Media Center.
You can find more information with more links HERE
As you can see not much has really changed overall… The addition of Blu-ray burning is nice, if you can afford a Blu-ray burner and the media. Improved indexing and searching can be a nice thing as well, I know I use the search quite often as I’m always forgetting where things are. Media Center improved TV recording, I think most people have DVRs at this point, but fro those of us that don’t it’s a nice feature I guess. The description really doesn’t tell us about that many changes made the the operating system, one way to find out if anything changed is of course test it, and that’s what I spent all day doing… fun-fun
Service Pack 2 weighed in at 577Mb when I got it, so it’s rather small for a ‘Service Pack’ , to me a service pack is a major upgrade, but this doesn’t seem to be really.
For my testing I used the standard stuff, Cinebench10, 2dMark06, CrystalMark and SiSoft Sandra 2009 SP3, and I also threw in some benchmarks from Crysis Warhead as well just to round things off a bit.
First off here’s my basic system specs:
-Intel C2Q9650 at 3ghz
-EVGA NF680i motherboard
-8 gigs of OCZ Fatal1ty DDR2 PC2-6400 Ram
-Diamond 4870 1gig video card
-Vista Ultimate X64
CrystalMark 2004R3
CrystalMark 2004R3 is a 32bit total benchmark software.
Crystalmark might seem old but it’s a nice suite of tests to get an idea of the performance of your computer, both separate components and overall. Yes I run Vista X64 and this is for 32bit, but the majority of the stuff we run on X64 is still 32bit.
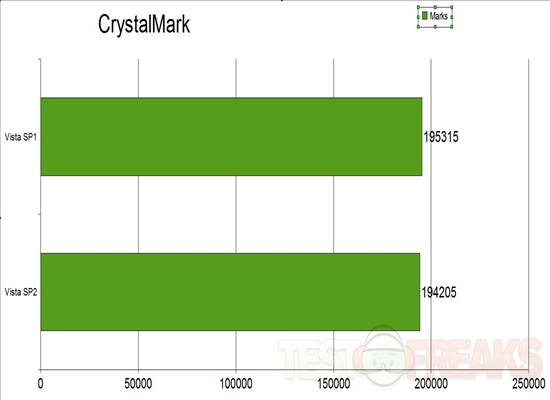
Here’s the overall scores of both service packs compared:
As you can see the overall score actually dropped a bit when moving to Service Pack 2.
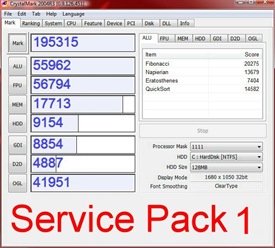
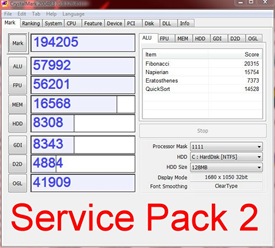
Here’s the individual scores:
Across the board everything dropped except for the ALU CPU benchmark, not sure what happened there.
CINEBENCH is a real-world test suite that assesses your computer’s performance capabilities. MAXON CINEBENCH is based on MAXON’s award-winning animation software CINEMA 4D, which is used extensively by studios and production houses worldwide for 3D content creation. MAXON software has been used in blockbuster movies such as Spider-Man, Star Wars, The Chronicles of Narnia and many more.
MAXON CINEBENCH runs several tests on your computer to measure the performance of the main processor and the graphics card under real-world circumstances. The benchmark application makes use of up to 16 CPUs or CPU cores and is available for Windows (32-bit and 64-bit) and Macintosh (PPC and Intel-based).
I used the 64bit version of Cinebench of course.
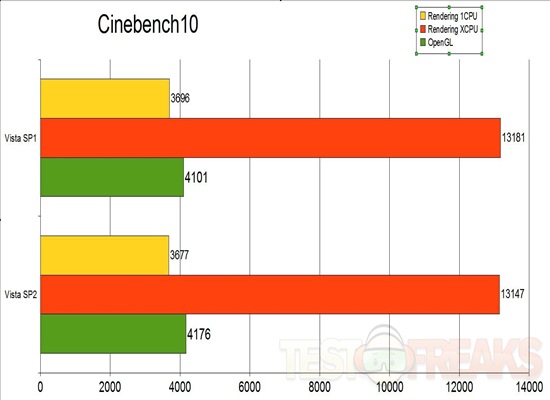
Like Crystalmark we see a drop in the CPU performance when going from SP1 to Sp2, but the OpenGL performance went up a tiny bit.
For a drop across both single core and multiple core rendering something had to change obviously, even though nothing was listed among changes to the core of the operating system.
SP2 release notes mentions ‘Hardware Support. Among other improvements.’ I’m guessing this has something to do with that, something is a bit off with how the OS handles my CPU now.
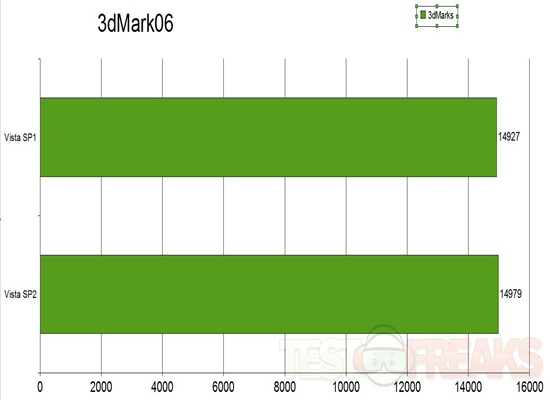
Don’t think this needs much of an introduction. Yes it’s an older benchmark, but it has it’s place especially for CPU intensive testing, and of course graphical testing as well.
Here we see an increase in performance, yes not much, but it’s an increase either way.
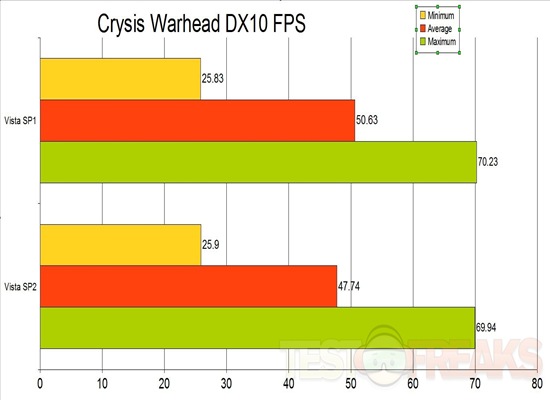
Crysis Warhead
-Resolution: 1680×1050
-2x AA
-Gamer Settings
-3 runs averaged out
-DX10
-Catalyst 9.5
With Crysis Warhead you can see we dropped a bit for the average and maximum frame rates when moving to SP2, the average though is still more than playable. We see the minimum frame rate went up just a teeny bit, nothing that would even be noticeable in gameplay I’m sure…
Now I’ve got SiSoft Sandra 2009 SP3 testing with many of the included benchmarks for memory, video and CPU processing, let’s see how it looks now.
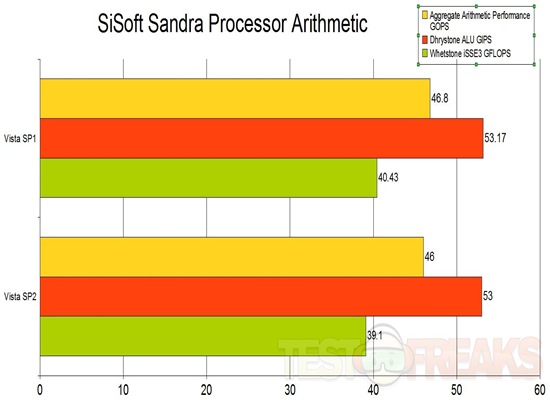
Processor Arithmetic
Benchmarks the ALU and FPU processor units. Shows how your processors handle arithmetic and floating point instructions in comparison to other typical processors.
Results Interpretation
Dhrystone (MIPS) – higher results are better, i.e. better integer performance.
Whetstone (MFLOPS) – higher results are better, i.e. better floating-point performance.
Here again we see a drop in processor performance when moving to service pack 2, a very slight drop but still a drop. That’s one thing nice about Sandra, it can see very small differences between tests. Would this small difference be felt in the real world? probably not..
Processor Multi-Media
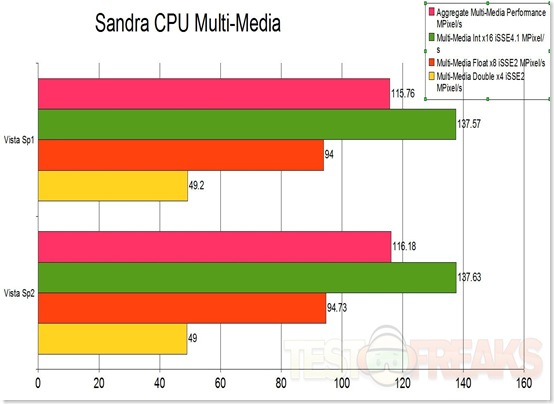
Benchmark the (W)MMX(2), SSE(2/3/4), AVX processor units. Shows how your processors handle multi-media instructions and data in comparison to other typical processors.
Such operations are used by more specialized software, e.g. image manipulation, video decoders/encoders, games.
Results Interpretation
Multi-Media Integer (Pixels/s) – higher results are better, i.e. better integer performance.
Multi-Media Single/Double Float (Pixels/s) – higher results are better, i.e. better floating-point performance.
There’s no doubt that our lives are very multi-media centric, we love our TV, movies and games, and this test is an important one for all of us I think.
Here we actually see a jump in scores when moving to service pack 2, this is a good thing of course, but again it’s so small that you most likely will never notice it in the real world.
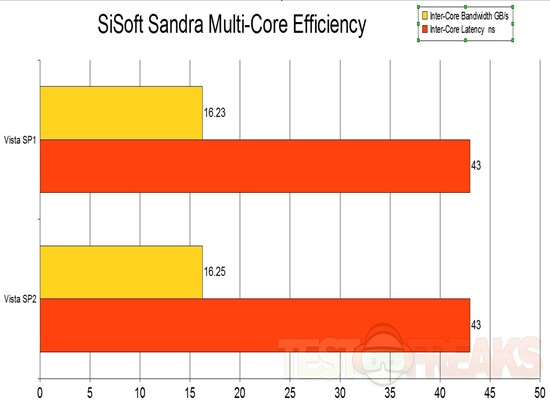
Multi-Core Efficiency
Benchmark the multi-core efficiency of the processors. Shows how efficient the processor cores and their inter-connects are .
The ability of the cores to process data blocks and pass them to another core for processing (producer-consumer paradigm) of different sizes and different chain sizes is measured. The efficiency of the inter-connect between cores is thus benchmarked; however, the number of cores (and processors) also counts as more data buffers can be processed simultaneously (aka “in flight”).
True multi-core processors that have shared L2/L3 caches will thus perform much better than cores that have separate caches and are connected by the traditional FSB.
Here we see no difference at all..
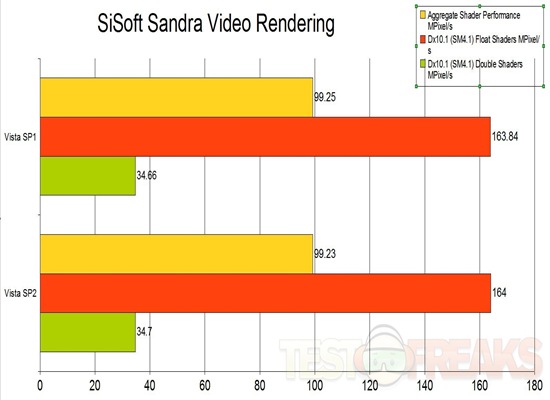
Video Rendering
Benchmark the graphics performance of the video adapters (GFXs). Shows how your graphics processors handle rendering in comparison to other typical graphics processors.
Such operations are used by all graphics software, image manipulation, video decoders/encoders, games and modern operating systems.
Results Interpretation
Float Shaders (Pixels/s) – higher results are better, i.e. better single (32-bit) floating-point performance.
Double Shaders (Pixels/s) – higher results are better, i.e. better double (64-bit) floating-point performance.
Here we go again with one related to multi-media things, but this is more graphics card related.
Got a mixed bag this time, with some going up and some going down, but again the differences as so small there’s likely to be no impact on the real world performance.
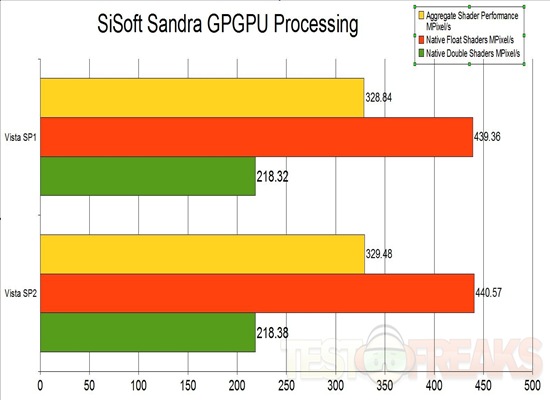
Graphics (GPGPU) Processing
Benchmark the graphics performance of the graphics processors (GPGPUs). Shows how your graphics processors handle instructions and data in comparison to other typical graphics processors.
Such operations are used by specialised software, e.g. scientific software, image manipulation, video decoders/encoders, games that make GPU performance pretty important.
Results Interpretation
Processing Float (Pixels/s) – higher results are better, i.e. better single (32-bit) floating-point performance.
Processing Double (Pixels/s) – higher results are better, i.e. better double (64-bit) floating-point performance.
Here’s another Graphics card based test, here we see the scores going up when we move to SP2, but not by any real discernible amount.
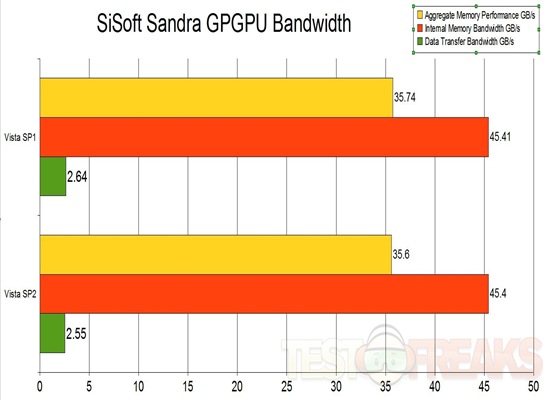
Graphics (GPGPU) Bandwidth
Benchmark the bandwidth of the memory of the graphics processors (GPGPUs) and the bandwidth of the bus that connects them to your computer. Shows how your graphics processors’ memory bandwidth compare to other video sub-systems in terms of bandwidth.
The speed at which the data can be sent to the GPGPUs, internally processed and the results sent back is as important as the processing power of the GPGPUs. The benchmark is based on the well-known STREAM memory benchmark, as implemented by the CPU memory benchmarks.
Results Interpretation
Internal Memory Bandwidth (MB/s) – higher results are better, i.e. faster internal memory bandwidth.
Data Transfer Bandwidth (MB/s) – higher results are better, i.e. faster data transfer between the GPU and computer.
So we have the last graphics test, this one is how it handles the graphics memory, and we see a slight drop actually when going to SP2. Again it’s not really relevant to much of anything in the real world..
The last two test I have are memory related test, I did them just to see what the differences might be if any..
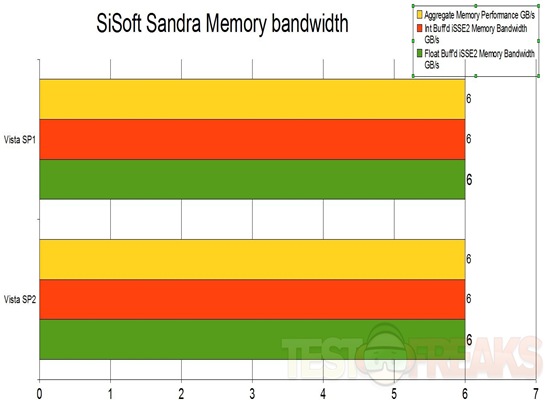
Memory Bandwidth
Benchmark the memory bandwidth of your computer. Shows how your memory sub-systems compare to other computers in terms of bandwidth.
The benchmark is based on the well-known STREAM memory benchmark.
Results Interpretation
Integer Memory Bandwidth (MB/s) – higher results are better, i.e. faster memory bandwidth.
Float Memory Bandwidth (MB/s) – higher results are better, i.e. faster memory bandwidth.
hmm.. looks the same to me…
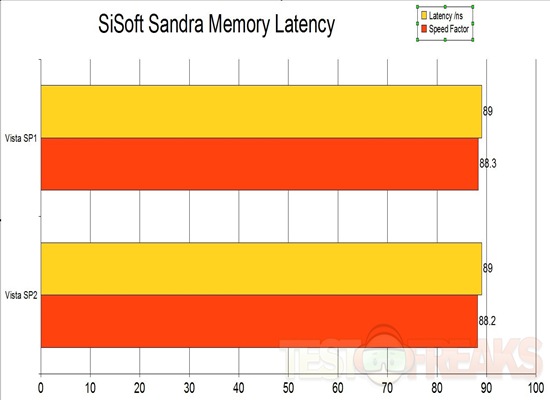
Memory Latency
Benchmark the latency (response time) of processors’ caches and memory. Shows how your processors’ caches and memory sub-systems compare to other computers in terms of latency.
The latency of caches is measured in processor clocks (i.e. how many clocks it takes for the data to be ready) as it is dependent on the processor clock speed.
The latency of memory is measured in nanoseconds as it is typically independent on processor clock speed.
Latency is lower = better
Speed Factor is higher = better
again look about the same….. oh well, satiated my curiosity anyway..
So, what have we learned here today?
Well I learned really that I think I wasted a good 20 hours messing with this stuff…
I’ve also learned that not much changed in terms of performance really between service pack 1 and service pack 2. Sure there are drops in performance in a lot of the tests, but they’re so small that the average user will never notice any difference. The tests that improve with the move to SP2 are the same way, they’re negligible differences really.
Is it worth it to upgrade to service pack 2?
That depends, most likely yes it is worth it for the hardware and software compatibility improvements, and of course any security benefits as well and the few new additions.


92 comments for “Vista SP1 vs SP2”